Tornado
Table of Contents
Most tornadoes are just a few dozen yards wide and touch down only briefly, but highly destructive tornadoes may carve out a path over a mile wide and several miles long. The destruction caused by tornadoes may range from light to inconceivable depending on the intensity, size and duration of the storm. Typically, tornadoes cause the greatest damages to structures of light construction, such as residential homes, and are quite localized in impact.
The United States has the highest incidence rate of tornadoes worldwide, with more than 1,000 occurring every year. Peak months of tornado activity for Kentucky and south central Indiana are usually April, May, and June. However, tornadoes have occurred in every month and at all times of the day or night.
Background + Extent
Tornado Classification
Fujita-Pearson Scale
The Fujita-Pearson Scale for Tornadoes was introduced in 1971 by Ted Fujita and Allen Pearson. The scale was applied retroactively to tornado reports from 1950 on for the National Oceanic and Atmospheric Administration’s National Tornado Database for the United States and for significant tornado events dating back to 1880. The devised scale was based on six categories and converts the degree and type of damage caused by a tornado into an estimation of the wind speeds inside the funnel.
F0: Gale tornado 40-72 mph
Some damage to chimneys; breaks branches off trees; pushes over shallow-rooted trees; damages to sign boards.
F1: Moderate tornado 73-112 mph
Some damage to chimneys; breaks branches off trees; pushes over shallow-rooted trees; damages to sign boards.
F2: Significant tornado 113-157 mph
Considerable damage. Roofs torn off frame houses; mobile homes demolished; boxcars pushed over; large trees snapped or uprooted; light object missiles generated.
F3: Severe tornado 158-206 mph
Roof and some walls torn off well-constructed houses; trains overturned; most trees in forest uprooted.
F4: Devastating tornado 207-260 mph
Well-constructed houses leveled; structures with weak foundations blown off some distance; cars thrown and large
missiles generated.
F5: Incredible tornado 261-318 mph
Strong frame houses lifted off foundations and carried considerable distances to disintegrate; automobile sized
missiles fly through the air in excess of 100 meters; trees debarked; steel re-enforced concrete structures badly damaged.
F6: inconceivable tornado
These winds are very unlikely. The small area of damage they might produce would probably not be recognizable along with
the mess produced by F4 and F5 wind that would surround the F6 winds. Missiles, such as cars and refrigerators would do
serious secondary damage that could not be directly identified as F6 damage. If this level is ever achieved, evidence for it
might only be found in some manner of ground swirl pattern, for it may never be identifiable through engineering studies.
Enhanced Fujita Scale
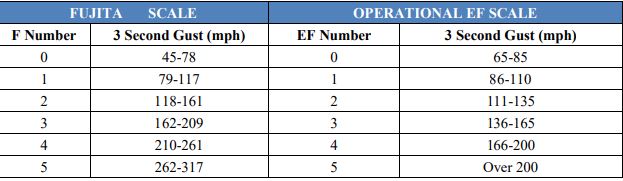
In an effort to address the deficiencies in the Fujita scale, the National Weather Service developed the Enhanced Fujita scale and it was implemented on February 1, 2007. The Enhanced Fujita scale is set of wind estimates, not measurements, based on damage. The enhanced scale takes into account quality of construction and standardizes different kinds of structures.
Past Events + Location + Extent
Between 2000 and 2020, the KIPDA Region received 11 FEMA Disaster Declarations that included tornadoes:
- DR-1310-KY: Kentucky Tornadoes, Severe Storms, Torrential Rains And Flash Flooding (January 2000)
- DR-1471-KY: Kentucky Severe Storms, Flooding, Mud And Rock Slides, And Tornadoes ( May 2003)
- DR-1523-KY: Kentucky Severe Storms, Tornadoes, Flooding, And Mudslides (May/June 2004)
- DR-1746-KY: Kentucky Severe Storms, Tornadoes, Straight-line Winds, And Flooding (February 2008)
- DR-1757-KY: Kentucky Severe Storms, Tornadoes, Flooding, Mudslides, And Landslides (April 2008)
- DR-1912-KY: Kentucky Severe Storms, Flooding, Mudslides, And Tornadoes (May 2010)
- DR-1925-KY: Kentucky Severe Storms, Flooding, Mudslides, And Tornadoes (May-June 2010)
- DR-1976-KY: Kentucky Severe Storms, Tornadoes, And Flooding (May 2011)
- DR-4057-KY: Kentucky Severe Storms, Tornadoes, Straight-line Winds, And Flooding (February/March 2012)
- DR-4217-KY: Kentucky Severe Storms, Tornadoes, Flooding, Landslides, And Mudslides (April 2015)
- DR-4239-KY: Kentucky Severe Storms, Tornadoes, Straight-line Winds, Flooding, Landslides, And Mudslides (June 2015)
The map and table below cover tornadoes that happen in the region between 1950 to 2020. While not each of these events received a FEMA declaration, each qualified as a tornado. Tornado details were obtained from Mississippi State’s Midsouth Tornado database, which sources past tornado events from the National Weather Service [1].
Historical Occurrences
To gain a better understanding of the magnitude of tornado impacts on the KIPDA Region, information regarding significant tornado events in the area follows.
- March 27, 1890 – A tornado, category F3 passed through Shelby and Henry counties. The tornado had a width of 150 yards and length of 5 miles. The tornado moved northeast from four miles south of Eminence passing one mile north of Pleasureville. Four from houses were destroyed with three family members losing their lives in one of them; ten others were injured.
- April 1, 1974 – A category F3 tornado with the a width of 300 yards and length of three miles touched down in Henry County leaving approximately 100 of the 500 residents of Campbellsburg homeless. Nineteen homes and 23 businesses were destroyed or damaged. Twenty people were injured and one lost their life.
- May 28, 1996 – A category F4 tornado began in the Jefferson Memorial Forest in southern Jefferson County before strengthening and moving Southeast across Bullitt County. The tornado caused a remarkable amount of damage while passing through Brooks, Hillview and Mount Washington totaling over $100 million in damages.
- February 6, 2005 – A category EF2 tornado with a width of 250 yards and length of 7 miles passed through Shelby County with the majority of the damaged concentrated in the Flood Road area. A large well-built barn was destroyed after the structure was thrown approximately 50 yards. An 18,000 pound trailer was moved four feet and turned over while another barn was destroyed with every shingle blown off a well-constructed roof. Several other homes suffered some degree of room damage while about 40 large hardwood trees were uprooted along the tornado’s path.
Probability
Occurrence
Between 1950 and 2020 (71 years), the KIPDA region experienced 63 tornadoes.
- Bullitt County: 10 tornadoes/71 years =14% chance of a tornado happening in a given year.
- Henry County: 14 tornadoes/71 years= 20% chance of a tornado happening in a given year.
- Oldham County: 9 tornadoes/71 years= 13% chance of a tornado happening in a given year.
- Shelby County: 16 tornadoes/71 years=23% chance of a tornado happening in a given year.
- Spencer County: 7 tornadoes/71 years=10% chance of a tornado happening in a given year.
- Trimble County: 11 tornadoes/71 years=15% chance of a tornado happening in a given year.
Wind Zone
The KIPDA region exists in the highest wind zone in the United States, zone IV, which translates to a threat of winds up to 250 miles per hour during a severe storm. This is the highest classification of wind zones and signifies the greatest tornado threat. The KIDPA region experiences the highest threat level for tornadoes during the spring months of April, May, and June.
Climate Change
The connection between climate change and tornadoes is uncertain.
Overall Probability
Overall, the KIPDA HMP ranks the probability of a tornado event for the region as high because of the frequency of past events and its wind zone classification.
Impact + Vulnerability
Tornadoes can be incredibly devastating to a community and can cause significant property damage and lead to injuries and loss of life.
Property Data
The dashboard below shows property damage claims in the KIPDA region between 2010 and 2020. KIPDA obtained this anonymized data from Verisk’s Exactware program, which runs ExactAnalysis. ExactAnalysis is the largest full-cycle claims management software and reporting tool in the property insurance industry. Please note that while tornadoes in the region show losses for each year, this does not mean that an official tornado occurred. These claims could be attributed to incredibly high winds that insurance companies label tornadoes.
Because this data has never been used for hazard mitigation planning before, KIPDA’s GIS analyst conducted extensive cleaning. To learn more about this process, click the data cleaning toggle below.
Claims Data Cleanup Actions Taken
Sort Ascending by Value; delete all 0 and negative (-) values in “Gross Estimate Amount” column (10924 rows had Zero for the amount 22.5% of total data)
Many suspect values remain ($1, etc. basically anything less than a deductible (typically $500 or
$1000) is suspicious to me and seems like that can’t be accurate (another 3320 have values under $500 and 6110 less than $1k)
Look at numeric “Type of Loss” able to ID that 104 – Wind and 150 – Water… need other numeric codes to ID type of hazard and make those rows useful… (Deleted all other numeric values (26 rows) for now, can restore from clean dataset later if desired)
Assumed GL69 = General Liability
Deleted “Type of Loss” 111-Theft(1); “All Other/ All Other Peril Not Enumerated/All other Perils/ All Other Physical Damage/ AOPD/APLWTR-APL (assumed this is appliance?)” (276) because doesn’t help our purposes if not associated with a NATURAL hazard; “Backup of sewer or drain (Sump Pump/Faulty Drain)”(10)
Skipped to Cause of Loss column because those details may be more helpful at initial elimination of non-weather related claims: Deleted “pipe burst …..”(1); “accidental breakage by insured”(1); “all other(FIRE)” because no wildfires that year; “animals/ insects” (1); “appliance”(12); “auto driven by nonresident”(1); “Back-up sewer drain/ bathroom sink clogged/ bathtub related/ broken pipe”(131); “Theft/ Burglary” (11); “candle” (6); “car ran through and destroyed(impact by vehicle)”(1); “cigarette smoking” (2); “fire sub loss” no wildfires in 2017 (1); “water damage toilet malfun”(1); “COL: water Sub Loss: escape from ap” (sounds like appliance?)(1); “contamination/pollution” (1) doesn’t specify source so unsure if natural hazard related; “cooking(FIRE)” (35); “Damage from vehicle – insured owned”(1); “Damage to Dwelling(Vandalism)”(5); “Damage to bathroom flooring(1)”; “damages to Claimant vehicle(CPL?)”(1); “Defective Appliances”(6); “Drain Bck (Drain backup??)”(4); “Dryer(FIRE)”(1); “Electric Baseboard Heater”(1); “Electrical Fire”(8); “Equipment(WATER)” (5); “Falling Objects”(1) unspecified source?; “Faulty Drain”(3); “Faulty Wiring”(20); “Fire”(20) verified date/location didn’t match wildfire data; “Fire-All other/Fireplace/Grease Fire”(3); “Fire Caused by Appliance”(5); “Fire Electrical” (1); “Fire External Source”(1)”; “Fire Total” (1); “Fireplace/SolidFuel/Chimney” (21); “Fire Erupted From Brush Hazard” (4) verified does not coincide with wildfire dates; “FNOL….. (Water/ Wind)” (4); “Frozen Pipe (Weather Related – No/ Non-weather)” (4); “Fungi/Bacteria”(1); “Furnace”(3); “Grease Fire in Kitchen”(13); “HVAC” (1); “int and ext damage (VANDALISM)” (1); “Jewelry Missing from home” (2); “Kitchen/ other than grease (FIRE)” (7); “leaking pipe…”(1); “Light(OTHER)” (2); “Light(WATER DAMAGE – APPLIANCE)”(1); “Moderate(OTHER/UNKNOWN)(1); “mold general/in kitchen(MOLD/OTHER)” (2); “Nearby Fire (SMOKE)”(2); “None(FIRE)”(2); “off Premises/ on premises (THEFT)”(11); “Other(BACKUP OF SEWER OR DRAIN)”(1); “Other(BURG/BURGLARY THEFT)”(92); “Other(COLLAPSE)”(1); “Other (COLL-VEH)”(5); “Other(DAMAGE BY VEHICLE WATERCRAFT)”(1); “Other(DRAIN BCK)”(8); “Other(FALLING OBJECT)” (9) Verified not on same date as a quake; “other(FIRE)”(85) Verified not on/near date/location of wildfire, (1) entry excluded from deletion because close to date/location of a wildfire; “Other (FIRE-APPL/COOK/ELEC/FIRPL/GASLK/OTHER/PORT/SMOKE/VEH/UNDT”(43); “Other(HURRICANE)(1)”; “Other(LIABILITY)”(1); “Other(MISCHIEF)”(1); “Other(MOLD/FUNGI)”(1); “Other(MYSTERIOUS DISAPPEARANCE)”(1); “Other(NONPF/SURG)”(1); “Other(NONWIND)”(5); “Other (OTH-AOC)”??? (55); “Other(OTHER)”(155); “Other (OTH-LOST/MOV/STC/VMM)”(9); “Other(PFSG-oth/pf/surge)”(4) Power failure?; “Other(PLBWTR-PLB/ PLUMBING)”(10); “Other(POWER OUTAGE)”(1); “Other(PRODUCT LIABILITY CLAIM)”(1); “Other (PROPERTY DAMAGE- All others)”(1); “Other (Sewage/drain/backup/sump pump)”(31); “Other(Smoke)”(4); “Other(Smpwtr-sum)”(1); “Other(STCOTH-STC)”(2); “Other (THEFT/Auto/nonauto/onp)”(44); “Other (Unknown LCI)”(4); “Other(Vandalism/malicious mischief)”(19); “other(VEHICLE)”(32); “Other(Vehicle damage)”(2); “Other (Wat/WATER/WATER DAMAGE/ NONWEATHER)” (370) left entries that specified “weather”; “Other(WATER/PLUMBING/Appliance/Other/Overflow)”(107); “Other(Weather related-no)”(9); “Other(WTR-APL/DAM)”(119): “Other(WTR-PLB)”(353); “Other(WTR-SUM)sump pump?(86); “Other- Narrative Required (FIRE) verified not coinciding location/date of wildfire (20); “Other – Narr Req (Mysterious Disappearance/ Sewer Backup/Vandalism/Water)” (17); “Other Non-Weather Related (WATER)” (23); “Other-Physical Damage”(1); “…foyer ceiling (WATER)”(1); “Pipe Burst / Pipe Burst– Non Weather Related(WATER)” Kept “weather related” entries (80); “Place of Business(THEFT)”(1); “Plmbg – xxx (WATER)”(26); “Plug-in Electric Heater”(1); “Plumbing/Leak (Water/ weather related-no/Water damage/Water non-weather)”(241); “Power Surge”(1); “…slow leak…”(1); “Roof Leak (Weather Related-No)” (1); “Roof Leak – Poor Cond.” (8); “Roof/Exterior Leak (Weather related – no)” (2); “Settlement Related Damage”(1); “Sewage”(1); “Sewer Back-Up from Appliance/Sink/etc.”(12); “Shower Pan”(2); “Sink Related”(9); “Sink/Tub/Toilet Overflow”(1); “Smoke(SMOKE)”(2); “Smoking (FIRE)” (6); “sub Loss: (MOLD)” (1); “escape from appli (WATER)”(3); “Sub Type lost…(THEFT)”(1); “sump pump (ALL)” (41); “water pipe broke and flooded…(WATER)”(2); “Theft (ALL)” (49); “Toilet… (WATER)”(99); “Undetermined (FIRE)”(2); “Unoccupied Dwelling (Vandalism)”(1); “Vandalism/ Mischief (all)”(18); “Vehicle”(20); “Washer Hose/ Washing Machine”(40); “Water (Liability P.D./ WATER)” unclear if natural hazard related (95); “Water – Appliance/ Other/Backup/External /Internal/Other/Plumbing”(26); “water escape from washer”(3); “Water Heater”(148); “Water Leak from damaged wall”(1); “Water Mold”(2); “Water Pipes”(); “Waterbed Burst”(1); “Weatheproofing Problems”(16)
Frozen Pipe entries left…but should we try to determine if they were during periods of “Extreme Cold”? Same with “Ice Dam”
Left “WTR-FLD and WTR-FRZ” on assumption those are flood and freeze related; left wtr-rof assuming that was a leak from the roof and those are usually related to a hazard (hail, etc)
Left “Rain Damage” and “Roof Leak” water claims for now….
Left “Weather Related” (Even though they said Drain Backup…)
Left entries related to weight of ice and snow
TONS of Hail entries…TONS of Wind
Continue “Type of Loss” because all remaining “Cause of Loss” are blank: Delete “*Extended”(99); “150 – Water” deleted due to no info about whether related to weather(11); “Backup of sewer or drain” (2); “Boardup/-up”(2); “Breakage”(1); “Burglary/Theft”(3); “Collapse”(19); “Collision”(18); “Damage by Vehicle”(8); “Drain Bck”(197); “Dwelling”(2); “Ext_wdr”??(1); “Falling Object” no idea what kind or why? (21); “FIRE” checked against wildand fire date/location before deleting (872); “fire or removal” (3); “general Liability/ GL69” (6); “Glass Breakage”(4); “Hurricane”(4) checked against hurricane records and left ones that coincided with dates storms reached KY; “Insured Travel Trailer…”(1); “Liability”(8); “Mischief”(2); “Mold/Fungi”(5); “Motor Vehicles”(1); “Mysterious Disappearance”(38); “Other”(535) kept weather related; “Plumbing”(17); “Powersurge”(1); “Product Liability Claim”(3); “Property/ Damage/All others/water”(8); “Renovation”(1); “Sewage/Sewer/Backup”(63); “Smoke/Damage”(39); “Tarping”(1); “Theft/OtherThan/FromAuto/OnP” (620); “Unknown/LCI”(234); “Vandalism/Mischief”(140); “Vehicle”(171); “Water/Damage/ApplianceRelated/non-weather”(3761) too many records to look up flood/severe cold events and compare date/ location for possibly flood/cold related…left weather-related and freezing records; “Water Non-Weather”(114); “Water Plum/bing”(10) kept water weather/flood; “Water/Plumbing”(18); “Water-Appliance”(15); Water-Other”(70); “Water-Overflow”(10); “Water-Plumbing”(42); “Weather Related – no”(3); “Wtr-apl”(1); “Wtroth”(1); “Wtr-sum”(1);
27000 of 48541 original records remain after cleanup
Mobile Homes
Residents of mobile homes are particularly vulnerable to tornado events because mobile homes lack a foundation and use weak building materials. KIPDA used 2019 ACS data to create a map that displays mobile home density by census tract. The percent of mobile homes by census tract ranges from 0% in Census Tract 307.02 in Oldham County to 31.2% in Census Tract 1001 in Trimble County.
To view specific data on the number and percent of housing units that are mobile homes, click on a census tract.
Because of limited warning time, strong tornadoes are prone to cause injury and death – especially in highly populated areas. Individuals in mobile homes are particularly vulnerable to tornadoes because these homes lack a foundation and use weak building materials.
Tornadoes have the capacity to damage and potentially destroy everything in their path. Therefore, they can cause severe property damage and loss. Tornadoes can also damage/destroy power and communications lines and cut off individuals’ access to power and/or cell service for weeks or more.
Tornadoes can uproot trees and other debris, which can damage the environment.
Data Limitations
Tornadoes are evaluated at the county level because they are non-spatial hazards and recorded at the county level.
Hazard Vulnerability Summary Analysis
The KIPDA Region experiences high vulnerability to tornadoes due to its location in wind zone IV, past events, and injuries/deaths from past events. While no jurisdiction is more likely to experience a tornado than another, areas that contain a denser population and thus have a higher building stock are more likely to experience a costly, devastating event.
- Bullitt County has around $47K in property damage claims due to tornadoes annually. It should be noted that tornadoes are not as frequent as severe storms or other types of hazards and do not cause substantial losses every year. However, their impact can be quite severe.
- Bullitt County has experienced 10 tornadoes/71 years =14% chance of a tornado happening in a given year.
- Since 1951, tornadoes that touched down in Bullitt County have caused 24 injuries. 14 injuries happened during tornadoes that only touched down in Bullitt County, while 10 injuries happened during tornadoes that touched multiple counties including Bullitt.
- Bullitt County contains two census tracts wherein at least 25% of all housing units are mobile homes.
Because of these factors, Bullitt County experiences high vulnerability to tornadoes. Because each of its cities contain clusters of building stock and greater population density, it can be assumed that Bullitt County’s cities experience high vulnerability to tornadoes as well.
- Henry County has around 8K in property damage claims due to tornadoes annually. It should be noted that tornadoes are not as frequent as severe storms or other types of hazards and do not cause substantial losses every year. However, their impact can be quite severe.
- Henry County has experienced 10 tornadoes/71 years =14% chance of a tornado happening in a given year.
- Since 1951, tornadoes that touched down in Henry County have caused 1 death and 46 injuries. It should be noted that 41 injuries happened during tornadoes that only touched down in Henry County, while 5 injuries happened during tornadoes that touched multiple counties including Henry.
- Henry County contains three census tracts wherein at least 15% of all housing units are mobile homes.
Because of these factors, Henry County experiences high vulnerability to tornadoes. Because each of its cities contain clusters of building stock and greater population density, it can be assumed that Henry County’s cities experience high vulnerability to tornadoes as well.
- Oldham County has around 50K in property damage claims due to tornadoes annually. It should be noted that tornadoes are not as frequent as severe storms or other types of hazards and do not cause substantial losses every year. However, their impact can be quite severe.
- Oldham County has experienced 9 tornadoes/71 years= 13% chance of a tornado happening in a given year.
- Since 1951, tornadoes that touched down in Oldham County have caused 231 injuries. It should be noted that 0 injuries happened during tornadoes that only touched down in Oldham County, while 231 injuries happened during tornadoes that touched multiple counties including Oldham.
- Less than 2% of all housing units are mobile homes in the majority of Oldham County’s census tracts. However, around 14% of all housing units in Oldham County’s Census Tract 303.01 are mobile homes.
Because of these factors, Oldham County experiences high vulnerability to tornadoes. Because each of its cities contain clusters of building stock and greater population density, it can be assumed that Oldham County’s cities experience high vulnerability to tornadoes as well.
- Shelby County has around 19K in property damage claims due to tornadoes annually. It should be noted that tornadoes are not as frequent as severe storms or other types of hazards and do not cause substantial losses every year. However, their impact can be quite severe.
- Shelby County has experienced 16 tornadoes/71 years=23% chance of a tornado happening in a given year.
- Since 1951, tornadoes that touched down in Shelby have caused 9 injuries. It should be noted that 8 injuries exclusively happened in Shelby County, and 1 injury occurred during a tornado that covered Jefferson, Oldham, and Shelby.
- Less than 9% of all housing units are mobile homes in all of Shelby County’s census tracts; however, around 10% of all housing units in Shelby County’s Census Tract 404.01 are mobile homes.
Because of these factors, Shelby County experiences high vulnerability to tornadoes. Because each of its cities contain clusters of building stock and greater population density, it can be assumed that Shelby County’s cities experience high vulnerability to tornadoes as well.
- Spencer County has around 6K in property damage claims due to tornadoes annually. It should be noted that tornadoes are not as frequent as severe storms or other types of hazards and do not cause substantial losses every year. However, their impact can be quite severe.
- Spencer County has experienced 7 tornadoes/71 years=10% chance of a tornado happening in a given year chance of a tornado happening in a given year.
- Since 1951, tornadoes that touched down in Spencer County have caused 92 injuries. It should be noted that 1 injury happened during a tornado that only touched down in Spencer County, while 91 injuries happened during tornadoes that touched multiple counties including Spencer.
- Spencer County contains two census tracts wherein at least 12% of all housing units are mobile homes.
Because of these factors, Spencer County experiences high vulnerability to tornadoes. Because each of its cities contain clusters of building stock and greater population density, it can be assumed that Spencer County’s cities experience high vulnerability to tornadoes as well.
- Trimble County has around 18K in property damage claims due to tornadoes annually. It should be noted that tornadoes are not as frequent as severe storms or other types of hazards and do not cause substantial losses every year. However, their impact can be quite severe.
- Trimble County has experienced 11 tornadoes/71 years=15% chance of a tornado happening in a given year.
- In 2012, a tornado that touched down in Clark, Scott, and Washington counties in Indiana and Trimble County in Kentucky, resulted in 11 deaths.
- Since 1951, tornadoes that touched down in Trimble County have caused 6 injuries. It should be noted that 1 injury happened during a tornado that only touched down in Trimble County, while 5 injuries happened during tornadoes that touched multiple counties including Trimble.
- Greater than 25% of all housing units are mobile homes in Trimble County’s only two census tracts .
Because of these factors, Trimble County experiences high vulnerability to tornadoes. Because each of its cities contain clusters of building stock and greater population density, it can be assumed that Trimble County’s cities experience high vulnerability to tornadoes as well.
References
[1] Mississippi State (2021). Midsouth Tornadoes [Data set]. Retrieved from https://midsouthtornadoes.msstate.edu/index.php?cw=lmk.