Extreme Heat
Table of Contents
Extreme heat is the leading cause of weather-related deaths in the U.S. and disproportionately targets the most vulnerable – children, older adults, and overweight people. The past seven years have been the world’s hottest on record, and summers with extreme heat events have become the norm. For example, in July of 2021, the Pacific Northwest experienced multiple heat waves, which resulted in hundreds of heat-related deaths.
The KIPDA region is particularly susceptible to wet bulb temperatures because its summers are consistently warm and humid. The combination of hot temps and high humidity create wet bulb temperatures. Wet bulb temperatures can make an 80 degree day feel like the hottest day in a Texas summer, which renders spending time outside not only difficult but potentially dangerous.
Description + Extent + Location + Past Events
FEMA defines extreme heat as a period of high heat and humidity with temperatures above 90 degrees for at least two to three days. Because of the high heat and humidity, your body struggles to maintain a normal temperature, which can lead to death.
Ambient air temperature is one component of heat; the other is humidity. High humidity inhibits your body’s ability to cool itself through evaporation of perspiration during high temperatures, which increases health risk. The National Weather Service developed the following heat index chart to explain the relationship between temperature and humidity.

Source: National Weather Service
The National Weather Service offers the following alerts for heat safety:
- Excessive Heat Warning: the maximum heat index temperature is expected to be 105° or higher for at least 2 days and night time air temperatures will not drop below 75°.
- Excessive Heat Watches: Heat watches are issued when conditions are favorable for an excessive heat event in the next 24 to 72 hours. A Watch is used when the risk of a heat wave has increased but its occurrence and timing is still uncertain.
- Heat Advisory: The maximum heat index temperature is expected to be 100° or higher for at least 2 days, and night time air temperatures will not drop below 75°.
- Excessive Heat Outlooks: The outlooks are issued when the potential exists for an excessive heat event in the next 3-7 days.
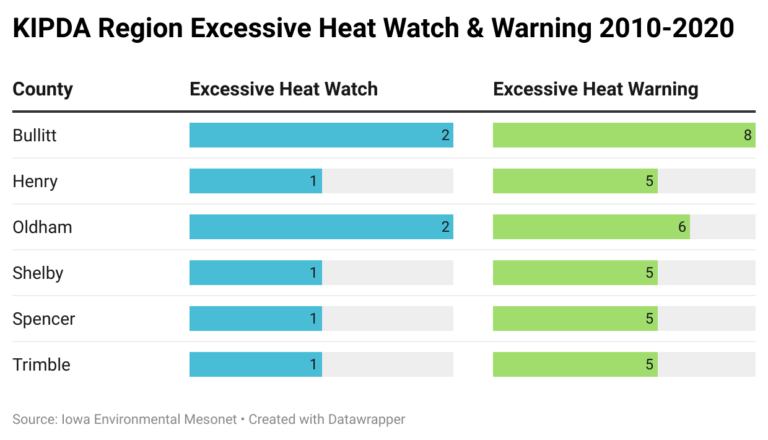
The dates of the excessive heat watches and warnings were obtained from the Iowa Environmental Mesonet. The Iowa Environmental Mesonet is a product of Iowa State University, and it collects national environmental data from cooperating members within observing networks. KIPDA employed data on excessive heat watches and warnings from the Iowa Environmental Mesonet because the NOAA’s National Center for Environmental Information (NCEI) did not have any records for excessive heat watches and warnings events within the KIPDA region in the past 20+ years [1].
Probability
Occurrence
Between 2010 and 2020, the KIPDA region experienced 34 excessive heat warnings. The following break down is by county:
- Bullitt: 8 excessive heat warnings/11 years = 73% chance of receiving a heat warning annually.
- Henry: 5 excessive heat warnings/11 years = 45% chance of receiving a heat warning annually.
- Oldham: 6 excessive heat warnings/11 years = 55% chance of receiving a heat warning annually.
- Shelby: 5 excessive heat warnings/11 years = 45% chance of receiving a heat warning annually.
- Spencer: 5 excessive heat warnings/11 years = 45% chance of receiving a heat warning annually.
- Trimble: 5 excessive heat warnings/11 years = 45% chance of receiving a heat warning annually.
Climate Change
In the KIPDA region, both heat and humidity are expected to increase due to climate change. This is particularly dangerous because high humidity means that the body can no longer cool itself by sweating. The combination of hot temperature and high humidity create wet bulb temperatures. Wet bulb temperatures can make an 80 degree day feel like the hottest day in a Texas summer, which renders spending time outside not only difficult but potentially dangerous [2].
The graphic below shows the projected number of high wet bulb temperature days between 2040-2060 under a high emissions scenario. The Wet Bulb Index Rating operates on a 0-10 scale with 10 being an extremely high number of wet bulb days. In 2020, Rhodium Group and Propublica released new climate maps for the U.S., and that data is used above. Find the original source here.
Overall Probability
Overall, the KIPDA ranks the probability of an extreme heat occurring in the region as high because of past heat warnings and the impacts of climate change.
Vulnerability & Impact
Impact on Agriculture
This dashboard displays the indemnity amount, which represents the dollar amount of yield loss due to heat. The dashboard also shows the number of acres that were impacted by heat [3].
Source: USDA Risk Management Agency
Yield losses due to heat are substantially less than yield losses attributed to drought. Moreover, agricultural losses due to heat do not occur as regularly as those due to drought. With that said, the KIPDA region still experienced millions of dollars in yield loss due to heat between 2000 and 2020. Shelby County experienced the greatest amount of yield loss between 2000 and 2020. This trend follows drought’s impact on the region as well, and it can likely be attributed to Shelby County’s high amount of agricultural land.
Heat Island Effect
The built environment – pavement, roads, and other infrastructure – absorb and re-emit the sun’s heat more than the natural environment – forests and bodies of water. Therefore, areas with dense development tend to be hotter than outlying areas. In urban areas, daytime temperatures can be 1-7 degrees Fahrenheit hotter during the day than outlying areas and 2-5 degrees hotter at night [4]. KIPDA’s HMP counties do not contain major urban centers; however, they do contain smaller urban areas, which are more likely to experience hotter temperatures [5]. KIPDA uses the Trust for Public Land’s urban heat island severity map to show heat island locations in the KIPDA region. Please note that due to technical constraints, the map is zoomed into KIPDA’s HMP counties but contains data for the entire U.S.
KIPDA used the Trust for Public Land’s urban heat island severity layer to develop the maps above. To see the nationwide map and learn more about the Trust for Public Land’s methodology click the button below.
- Prolonged exposure to extreme heat can lead to heat rash, sunburn, heat cramps, heat exhaustion, and heat stroke. Heat stroke can cause serious permanent disability and even death if emergency treatment is not provided.
- In terms of responses to extreme heat physically, the elderly and the very young are more in danger. Extreme heat can lead to heat-related illnesses (e.g. heat stroke, heat exhaustion, heat cramps) and, in some cases, death.
- Minorities and low-income individuals are more likely to live in heat islands, which have limited green space and shade. Moreover, these individuals may not have the financial means to pay for air condition. This can lead to greater periods of exposure to extreme heat.
- Extreme heat can also negatively impact air quality.
- When extreme heat occurs it can cause a substantial uptick in electricity use (i.e. air conditioners), which can impact utilities. Extreme heat can also effect electricity transmission.
- Heat can increase the likelihood of pavement deterioration and railroad buckling/warping.
- Extreme heat can also lead to power grid failures and outages.
- Extreme heat can stress wildlife and even lead to wildlife deaths.
Hazard Vulnerability Summary Analysis
The KIPDA region as a whole has a near uniform risk of experiencing an extreme heat event annually. However, factors such as development and acres of agricultural land make certain communities in the region more vulnerable to heat. The impact of extreme heat is nuanced because greater development intensifies the heat island effect, which primarily impacts human health and mortality, while heat can also affect less developed agricultural communities by lowering crop yields. KIPDA’s counties have urban and rural characteristics, so both of these impacts are relevant. Because of past events, climate change, agricultural losses, and increased development, the KIPDA region has a moderate to high vulnerability to extreme heat.
- Bullitt County has experienced 8 excessive heat warnings in the past 11 years.
- Bullitt County is projected to experience 25 to 40 high wet bulb temperature days annually between 2040-2060 under a high emissions scenario.
- Within Bullitt County, Hillview, Mount Washington, and Shepherdsville are the most vulnerable areas to extreme heat because of greater development that has led to at least some level of heat island severity. This is a more acute vulnerability factor because the primary impact of the heat island effect is on human health and mortality. Older adults and low-income people with limited access to air condition are the most vulnerable in these areas.
- Bullitt County is the most populated county in the KIPDA region and is one of the top ten fastest growing counties in the state. Therefore, it has a more robust (and growing) built environment, which will intensify the heat island effect.
- Extreme heat can also impact agriculture in Bullitt County; however, the greatest annual loss the county experienced between 2000 and 2020 was $60,000, which is insignificant when compared to other counties in the region.
Because of these factors, Bullitt County demonstrates a moderate to high vulnerability to extreme heat. The primary concern related to extreme heat in Bullitt County is human health – especially the elderly and very young. Bullitt County’s cities reflect Bullitt County’s overall demographic profile, and therefore its cities experience moderate to high vulnerability as well.
- Henry County has experienced 5 excessive heat events in the past 11 years.
- Henry County is projected to experience 10 to 15 high wet bulb temperature days annually between 2040-2060 under a high emissions scenario.
- Henry County’s cities do not demonstrate any level of heat island severity.
- The county did experience $300,000 of crop losses due to heat in 2011, which is significant.
- Henry has x% of adults over 65.
- Henry has x% of children under 18.
- Henry has a poverty percentage of %.
While Henry County may be less vulnerable than other counties due to lack of development, the county still experiences moderate to high vulnerability to extreme heat due to past events, climate change, agricultural losses, and a significant poverty rate.
The primary concern related to extreme heat in Henry County is human health – especially the elderly, children, and low-income people. Henry County’s cities reflect Henry County’s overall demographic profile, and therefore its cities experience moderate to high vulnerability as well.
- Oldham County has experienced 6 extreme heat events in the past 11 years.
- Oldham County is projected to experience 10 to 15 high wet bulb temperature days annually between 2040-2060 under a high emissions scenario.
- Within Oldham County, La Grange, Buckner (not an incorporated city), and Crestwood/Pewee Valley are the most vulnerable areas to extreme heat because of greater development that has led to at least some level of heat island severity. This is a more acute vulnerability factor because the primary impact of the heat island effect is on human health and mortality. Older adults and low-income people with limited access to air condition are the most vulnerable in these areas.
- Oldham County is the second most populated county in the KIPDA region and is one of the top ten fastest growing counties in the state. Therefore, it has a more robust (and growing) built environment, which will intensify the heat island effect.
- Extreme heat can also impact agriculture in Oldham County; however, the greatest annual loss the county experienced between 2000 and 2020 was $40,000, which is insignificant when compared to other counties in the region.
- Oldham County has x % of adults over 65.
- Oldham County has x% of children under 18.
Because of these factors, Oldham County demonstrates a moderate to high vulnerability to extreme heat. The primary concern related to extreme heat in Oldham County is human health – especially the elderly and very young. Oldham County’s cities reflect Oldham County’s overall demographic profile, and therefore its cities experience moderate to high vulnerability as well.
- Shelby County has experienced 5 excessive heat warnings in the last 11 years.
- Shelby County is projected to experience 15 to 25 high wet bulb temperature days annually between 2040-2060 under a high emissions scenario.
- Shelby County is the third most populated county in the KIPDA region and is one of the top ten fastest growing counties in the state. Therefore, it has a more robust (and growing) built environment, which will intensify the heat island effect.
- Within Shelby County, Shelbyville is the most vulnerable areas to extreme heat because of greater development that has led to at least some level of heat island severity. This is a more acute vulnerability factor because the primary impact of the heat island effect is on human health and mortality. Older adults and low-income people with limited access to air condition are the most vulnerable in these areas.
- Extreme heat can also impact agriculture in Shelby County, and losses have been significant in the past. In 2011 alone, Shelby County experienced over $2 million in crop losses due to heat, which is significantly higher than any other county in the region.
- Shelby County has x % of adults over 65.
- Shelby County has x% of children under 18.
Because of these factors, Shelby County demonstrates a moderate to high vulnerability to extreme heat. Both human health and agriculture are at substantial risk to extreme heat events in Shelby County. Because Shelby County’s cities, Shelbyville and Simpsonville, occupy a small percentage of Shelby’s overall acreage and farmland, their primary concern related to extreme heat is human health effects. Shelby County’s cities reflect Shelby County’s overall demographic profile, and therefore its cities experience moderate to high vulnerability as well.
- Spencer County has experienced 5 excessive heat warnings in the past 11 years.
- Spencer County is projected to experience 25 to 40 days of high wet bulb temperatures annually between 2040-2060 under a high emissions scenario.
- Spencer County’s city, Taylorsville, does not demonstrate any level of heat island severity. However, Spencer County is growing rapidly, and was one of the top 10 Kentucky counties with the biggest population growth according to the 2020 U.S. Census. This growth leads to more development, which in turn can intensify the heat island effect.
- The county did experience approximately $150,000 of crop losses due to heat in 2010 and 2011.
While Spencer County may be less vulnerable than other counties due to lack of development, the county still experiences moderate to high vulnerability to extreme heat due to past events, climate change, growth and agricultural losses. Because Taylorsville does not demonstrate does not demonstrate any level of heat island severity and does not contain significant agricultural acreage, it demonstrates low to moderate vulnerability to heat events.
- Trimble County experienced 5 excessive heat warnings in the past 11 years.
- Trimble County is projected to experience 10 to 15 days of high wet bulb temperatures annually between 2040-2060 under a high emissions scenario.
- Trimble is KIPDA’s least populated counties with incredibly low population density. However, the area around one of its cities, Milton, does experience at least some level of heat island severity.
- It did not experience significant crop losses due to heat between 2000 and 2020. The greatest annual loss that the county experienced was approximately $60,000 in 2011.
- It should be noted that Trimble County demonstrates one of the lowest median household incomes in the KIPDA region, and low-income people are more vulnerable to heat events due to lack of resources.
- Trimble County has x% of adults over 65.
- Trimble County has x% of children under 18.
- Trimble County has a poverty percentage of %.
While Trimble County may be less vulnerable than other counties due to lack of development and limited agricultural losses, the county still experiences moderate to high vulnerability to extreme heat due to past events, climate change, growth and its low-income population.
Trimble County’s cities reflect Trimble County’s overall demographic profile, and therefore its cities experience moderate to high vulnerability as well.
It should be noted that Bedford has one of the lowest median household incomes of any city within the KIPDA region at less than $20,000 and therefore, is particularly vulnerable to an extreme heat event.
References
[1] Iowa State University (2021). Archived NWS Watch, Warnings, and Advisories, 2010-2020. [Data set]. Iowa Environmental Mesonet. Retrieved from https://mesonet.agron.iastate.edu/request/gis/watchwarn.phtml
[2] Lustgarten, A., Shaw, A., P., & Goldsmith, J. (2020, September 15). New Climate Maps Show a Transformed United States. Retrieved from https://projects.propublica.org/climate-migration/
[3] USDA Risk Management Agency (2021). Cause of loss. [Data set]. Retrieved from https://www.rma.usda.gov/en/Information-Tools/Summary-of-Business/Cause-of-Loss
[4] Environmental Protection Agency (2021). Heat Island Effect. Retrieved from https://www.epa.gov/heatislands
[5] The Trust for Public Land (2021). Urban heat island severity for U.S. cities. [Data set]. Retrieved from https://tpl.maps.arcgis.com/apps/webappviewer/index.html?id=1b6cad6dd5854d2aa3d215a39a4d372d