Hail
Table of Contents
Hail is a type of precipitation which is formed when updrafts in thunderstorms carry raindrops into extremely cold areas of the atmosphere and freezes them. These frozen raindrops grow by colliding with super-cooled water drops creating ‘hailstones’. Thunderstorms which have a strong updraft keep lifting the hailstones up to the top of the cloud, increasing the amount of moisture they collect. The hail falls when the thunderstorm’s updraft can no longer support the weight of the ice. The stronger the updraft, the larger the hailstone can grow.
Background + Extent
What causes hail?
Hail is the result of two general weather conditions.
- Meso-scale thunderstorms.
- Physiographic features, large bodies of water, and localized convection can develop localized thunderstorms that can be conducive to hail.
Measuring hail - TORRO Hailstorm Intensity Scale
- .25 – .50 inch: size of pea
- .75 inch: size of penny
- .88 inch: size of nickel
- 1.00 inch: size of quarter
- 1.25 inch: size of half dollar
- 1.50 inch: size of walnut/ping pong
- 1.75 inch: size of golf ball
- 2.00 inch: size of hen egg
- 2.50 inch: size of tennis ball
- 2.75 inch: size of baseball
- 3.0 inch: size of tea cup
- 4.0 inch: size of grape fruit
- 4.50 inch: size of softball
Hail Extent and past events in KIPDA Region
Hail is a non-spatial hazard and is evaluated at the county level. The following information identifies the largest hail size experienced in each county between 2000 and 2020. For extent by event, use the map below or click on the view data button.
- Bullitt County
- May 1, 2002: 2.75 inch size hail fell.
- Henry County
- April 5, 2010, October 7, 2014, and April 5, 2017: 1.75 inch size hail fell.
- Oldham County
- July 2, 2002, May 9, 2003, May 17, 2004, May 19, 2005, June 5, 2007, May 15, 2009, October 7, 2014, May 11, 2016, and March 14, 2019: 1.75 inch size hail fell.
- Shelby County
- May 5, 2004, June 5, 2007, and September 21, 2013: 1.75 inch size hail fell.
- Spencer County
- May 2, 2012: 2.5 inch size hail fell.
- Trimble County
- July 20, 2018: 2.75 inch size hail fell.
Location + Past Events
Use the dashboard below to learn about past hail events in the KIPDA region between 2000 and 2020.
Probability
Occurrence
Between 2000 and 2020 (21 years), the KIPDA region experienced 84 distinct hail events. Please note that hail events, which share the same episode number from NCEI, are classified as the same event.
- Bullitt County: 22 hail events/21 years = 1.04 hail events annually
- Henry County: 21 hail events/21 years = 1 hail event annually
- Oldham County: 28 hail events/21 years = 1.3 hail events annually
- Shelby County: 26 hail events/21 years = 1.2 hail events annually
- Trimble: 11 hail events/21 years = 0.5 hail events annually
Climate Change
The effect of climate change on the occurrence of hailstorms is a combination of the effects that it will have on cold temperatures and precipitation. A weakening of the polar vortex has caused cold air to be blown toward the mid-latitudinal regions of the globe, making winters colder. [1] A decrease in the amount of ice in the Arctic, coupled with the increase of atmospheric water vapor in the area, causes there to be more moisture in the air in the Midwestern United States during the winter. [2] [3] The increased amount of moisture results in more precipitation. This evidence indicates that there will be a greater occurrence of hailstorms in some areas of the United States, but the severity of those possible storms and the size of the hail is specific to each location.
The Midwestern United States is in the region where winter precipitation is expected to increase. [4] The climate predictions given from a 2017 study, however, predict a decrease in the amount of hailstorms in the Kentuckiana region. [5] The study specifically cited Kentucky as a state where hail is expected to melt before reaching the surface in the spring. Atmospheric scientist Robert Trapp thinks that the size of hail will increase, regardless of the increase or decrease in the frequency of hailstorms. [6] A 2019 study conducted by the University of Albany also supports this claim, showing that parts of the Midwest had a 10 to 15 day uptick in the number of days with favorable conditions for large hail between 1979 and 2017. [7] The map below shows that the Kentuckiana region is one of the parts of the US with the most significant increase in large hail parameter days.

Source: Adapted from Trends in United States large hail environments and observations (2019)
There is a general consensus that the size of hail will increase. The impact of climate change on the frequency of the occurrence of hailstorms is uncertain. There is not enough current research done on the matter to arrive at a sure conclusion. [8]
Overall Probability
Overall, the KIPDA HMP ranks the probability of a hail event for the region as extremely high because of its high annual frequency.
Impact + Vulnerability
The primary impacts of hail are property and infrastructure damages and personal injuries. Even a relatively small hail event can shred plants to ribbons in a matter of minutes. Vehicles, roofs of buildings and homes, and landscaping are the other things most commonly damaged by hail.
Property Data
The dashboard below shows property damage claims in the KIPDA region between 2010 and 2020. KIPDA obtained this anonymized data from Verisk’s Exactware program, which runs ExactAnalysis. ExactAnalysis is the largest full-cycle claims management software and reporting tool in the property insurance industry. In the past, hazard mitigation plans have used estimates from the National Weather Service; these figures rely on local reporting and do not typically capture property loss. Therefore, this data from the ExactAnalysis program has provided a more robust data set on the true cost of hail events. Please note that this data is only available at the county level.
Because this data has never been used for hazard mitigation planning before, KIPDA’s GIS analyst conducted extensive cleaning. To learn more about this process, click the data cleaning toggle below.
Claims Data Cleanup Actions Taken
Sort Ascending by Value; delete all 0 and negative (-) values in “Gross Estimate Amount” column (10924 rows had Zero for the amount 22.5% of total data)
Many suspect values remain ($1, etc. basically anything less than a deductible (typically $500 or
$1000) is suspicious to me and seems like that can’t be accurate (another 3320 have values under $500 and 6110 less than $1k)
Look at numeric “Type of Loss” able to ID that 104 – Wind and 150 – Water… need other numeric codes to ID type of hazard and make those rows useful… (Deleted all other numeric values (26 rows) for now, can restore from clean dataset later if desired)
Assumed GL69 = General Liability
Deleted “Type of Loss” 111-Theft(1); “All Other/ All Other Peril Not Enumerated/All other Perils/ All Other Physical Damage/ AOPD/APLWTR-APL (assumed this is appliance?)” (276) because doesn’t help our purposes if not associated with a NATURAL hazard; “Backup of sewer or drain (Sump Pump/Faulty Drain)”(10)
Skipped to Cause of Loss column because those details may be more helpful at initial elimination of non-weather related claims: Deleted “pipe burst …..”(1); “accidental breakage by insured”(1); “all other(FIRE)” because no wildfires that year; “animals/ insects” (1); “appliance”(12); “auto driven by nonresident”(1); “Back-up sewer drain/ bathroom sink clogged/ bathtub related/ broken pipe”(131); “Theft/ Burglary” (11); “candle” (6); “car ran through and destroyed(impact by vehicle)”(1); “cigarette smoking” (2); “fire sub loss” no wildfires in 2017 (1); “water damage toilet malfun”(1); “COL: water Sub Loss: escape from ap” (sounds like appliance?)(1); “contamination/pollution” (1) doesn’t specify source so unsure if natural hazard related; “cooking(FIRE)” (35); “Damage from vehicle – insured owned”(1); “Damage to Dwelling(Vandalism)”(5); “Damage to bathroom flooring(1)”; “damages to Claimant vehicle(CPL?)”(1); “Defective Appliances”(6); “Drain Bck (Drain backup??)”(4); “Dryer(FIRE)”(1); “Electric Baseboard Heater”(1); “Electrical Fire”(8); “Equipment(WATER)” (5); “Falling Objects”(1) unspecified source?; “Faulty Drain”(3); “Faulty Wiring”(20); “Fire”(20) verified date/location didn’t match wildfire data; “Fire-All other/Fireplace/Grease Fire”(3); “Fire Caused by Appliance”(5); “Fire Electrical” (1); “Fire External Source”(1)”; “Fire Total” (1); “Fireplace/SolidFuel/Chimney” (21); “Fire Erupted From Brush Hazard” (4) verified does not coincide with wildfire dates; “FNOL….. (Water/ Wind)” (4); “Frozen Pipe (Weather Related – No/ Non-weather)” (4); “Fungi/Bacteria”(1); “Furnace”(3); “Grease Fire in Kitchen”(13); “HVAC” (1); “int and ext damage (VANDALISM)” (1); “Jewelry Missing from home” (2); “Kitchen/ other than grease (FIRE)” (7); “leaking pipe…”(1); “Light(OTHER)” (2); “Light(WATER DAMAGE – APPLIANCE)”(1); “Moderate(OTHER/UNKNOWN)(1); “mold general/in kitchen(MOLD/OTHER)” (2); “Nearby Fire (SMOKE)”(2); “None(FIRE)”(2); “off Premises/ on premises (THEFT)”(11); “Other(BACKUP OF SEWER OR DRAIN)”(1); “Other(BURG/BURGLARY THEFT)”(92); “Other(COLLAPSE)”(1); “Other (COLL-VEH)”(5); “Other(DAMAGE BY VEHICLE WATERCRAFT)”(1); “Other(DRAIN BCK)”(8); “Other(FALLING OBJECT)” (9) Verified not on same date as a quake; “other(FIRE)”(85) Verified not on/near date/location of wildfire, (1) entry excluded from deletion because close to date/location of a wildfire; “Other (FIRE-APPL/COOK/ELEC/FIRPL/GASLK/OTHER/PORT/SMOKE/VEH/UNDT”(43); “Other(HURRICANE)(1)”; “Other(LIABILITY)”(1); “Other(MISCHIEF)”(1); “Other(MOLD/FUNGI)”(1); “Other(MYSTERIOUS DISAPPEARANCE)”(1); “Other(NONPF/SURG)”(1); “Other(NONWIND)”(5); “Other (OTH-AOC)”??? (55); “Other(OTHER)”(155); “Other (OTH-LOST/MOV/STC/VMM)”(9); “Other(PFSG-oth/pf/surge)”(4) Power failure?; “Other(PLBWTR-PLB/ PLUMBING)”(10); “Other(POWER OUTAGE)”(1); “Other(PRODUCT LIABILITY CLAIM)”(1); “Other (PROPERTY DAMAGE- All others)”(1); “Other (Sewage/drain/backup/sump pump)”(31); “Other(Smoke)”(4); “Other(Smpwtr-sum)”(1); “Other(STCOTH-STC)”(2); “Other (THEFT/Auto/nonauto/onp)”(44); “Other (Unknown LCI)”(4); “Other(Vandalism/malicious mischief)”(19); “other(VEHICLE)”(32); “Other(Vehicle damage)”(2); “Other (Wat/WATER/WATER DAMAGE/ NONWEATHER)” (370) left entries that specified “weather”; “Other(WATER/PLUMBING/Appliance/Other/Overflow)”(107); “Other(Weather related-no)”(9); “Other(WTR-APL/DAM)”(119): “Other(WTR-PLB)”(353); “Other(WTR-SUM)sump pump?(86); “Other- Narrative Required (FIRE) verified not coinciding location/date of wildfire (20); “Other – Narr Req (Mysterious Disappearance/ Sewer Backup/Vandalism/Water)” (17); “Other Non-Weather Related (WATER)” (23); “Other-Physical Damage”(1); “…foyer ceiling (WATER)”(1); “Pipe Burst / Pipe Burst– Non Weather Related(WATER)” Kept “weather related” entries (80); “Place of Business(THEFT)”(1); “Plmbg – xxx (WATER)”(26); “Plug-in Electric Heater”(1); “Plumbing/Leak (Water/ weather related-no/Water damage/Water non-weather)”(241); “Power Surge”(1); “…slow leak…”(1); “Roof Leak (Weather Related-No)” (1); “Roof Leak – Poor Cond.” (8); “Roof/Exterior Leak (Weather related – no)” (2); “Settlement Related Damage”(1); “Sewage”(1); “Sewer Back-Up from Appliance/Sink/etc.”(12); “Shower Pan”(2); “Sink Related”(9); “Sink/Tub/Toilet Overflow”(1); “Smoke(SMOKE)”(2); “Smoking (FIRE)” (6); “sub Loss: (MOLD)” (1); “escape from appli (WATER)”(3); “Sub Type lost…(THEFT)”(1); “sump pump (ALL)” (41); “water pipe broke and flooded…(WATER)”(2); “Theft (ALL)” (49); “Toilet… (WATER)”(99); “Undetermined (FIRE)”(2); “Unoccupied Dwelling (Vandalism)”(1); “Vandalism/ Mischief (all)”(18); “Vehicle”(20); “Washer Hose/ Washing Machine”(40); “Water (Liability P.D./ WATER)” unclear if natural hazard related (95); “Water – Appliance/ Other/Backup/External /Internal/Other/Plumbing”(26); “water escape from washer”(3); “Water Heater”(148); “Water Leak from damaged wall”(1); “Water Mold”(2); “Water Pipes”(); “Waterbed Burst”(1); “Weatheproofing Problems”(16)
Frozen Pipe entries left…but should we try to determine if they were during periods of “Extreme Cold”? Same with “Ice Dam”
Left “WTR-FLD and WTR-FRZ” on assumption those are flood and freeze related; left wtr-rof assuming that was a leak from the roof and those are usually related to a hazard (hail, etc)
Left “Rain Damage” and “Roof Leak” water claims for now….
Left “Weather Related” (Even though they said Drain Backup…)
Left entries related to weight of ice and snow
TONS of Hail entries…TONS of Wind
Continue “Type of Loss” because all remaining “Cause of Loss” are blank: Delete “*Extended”(99); “150 – Water” deleted due to no info about whether related to weather(11); “Backup of sewer or drain” (2); “Boardup/-up”(2); “Breakage”(1); “Burglary/Theft”(3); “Collapse”(19); “Collision”(18); “Damage by Vehicle”(8); “Drain Bck”(197); “Dwelling”(2); “Ext_wdr”??(1); “Falling Object” no idea what kind or why? (21); “FIRE” checked against wildand fire date/location before deleting (872); “fire or removal” (3); “general Liability/ GL69” (6); “Glass Breakage”(4); “Hurricane”(4) checked against hurricane records and left ones that coincided with dates storms reached KY; “Insured Travel Trailer…”(1); “Liability”(8); “Mischief”(2); “Mold/Fungi”(5); “Motor Vehicles”(1); “Mysterious Disappearance”(38); “Other”(535) kept weather related; “Plumbing”(17); “Powersurge”(1); “Product Liability Claim”(3); “Property/ Damage/All others/water”(8); “Renovation”(1); “Sewage/Sewer/Backup”(63); “Smoke/Damage”(39); “Tarping”(1); “Theft/OtherThan/FromAuto/OnP” (620); “Unknown/LCI”(234); “Vandalism/Mischief”(140); “Vehicle”(171); “Water/Damage/ApplianceRelated/non-weather”(3761) too many records to look up flood/severe cold events and compare date/ location for possibly flood/cold related…left weather-related and freezing records; “Water Non-Weather”(114); “Water Plum/bing”(10) kept water weather/flood; “Water/Plumbing”(18); “Water-Appliance”(15); Water-Other”(70); “Water-Overflow”(10); “Water-Plumbing”(42); “Weather Related – no”(3); “Wtr-apl”(1); “Wtroth”(1); “Wtr-sum”(1);
27000 of 48541 original records remain after cleanup
Impact on Agriculture
This dashboard displays the indemnity amount, which represents the dollar amount of yield loss due to hail. The dashboard also shows the number of acres that were impacted by hail. [9]
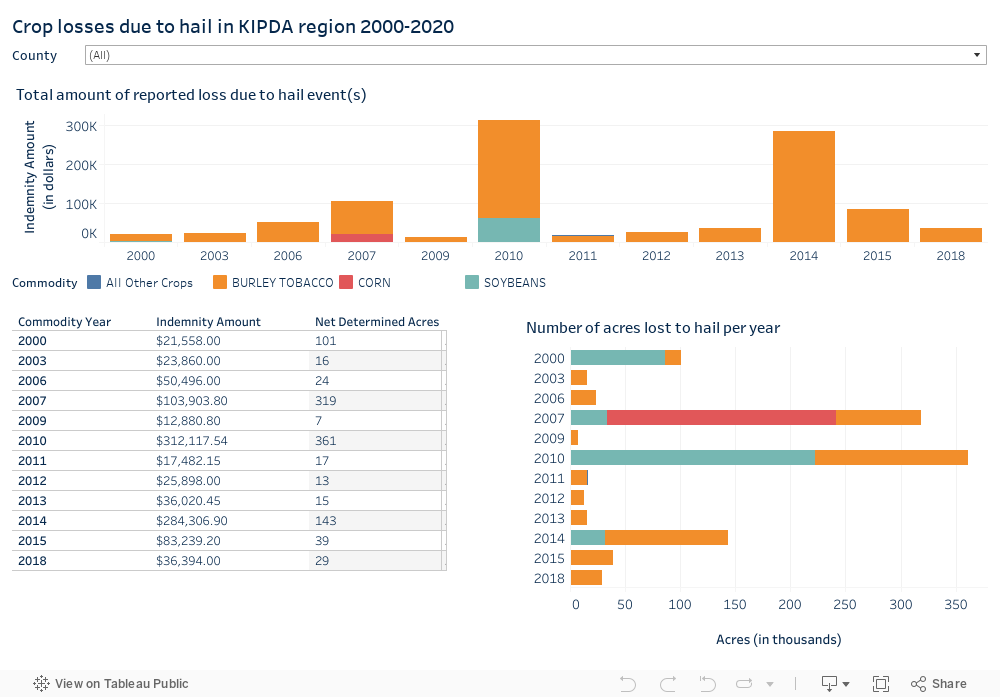
Source: USDA Risk Management Agency
Crop losses related to hail are substantially less than residential property claims related to heat or drought. This is true for every county in the KIPDA region. It should be noted that Henry, Shelby, and Trimble experienced the highest crop losses from hail. This is likely because Henry and Trimble are highly rural and agricultural, and Shelby County contains the highest agricultural acreage in the region.
- People, who are outside or without shelter, exhibit the highest vulnerability to hail. Hail can cause injuries or in extreme cases even death. However, this is extremely rare and there have been only a handful of deaths due to hail in the past 100 years. Only 4 deaths due to hail have occurred since 2000. [10]
- Hail can also cause power outages. Power outages particularly affect individuals who have medical devices that require electricity.
- Individuals that live in mobile homes are particularly vulnerable to hail. Mobile homes do not provide robust shelter and can be damaged or destroyed by hail.
- Hail can damage roofs, break windows, and cause other forms of property damage. Hail not only impacts homes but can severely damage and even total vehicles. The primary impact of hail is property damage.
- Hail can damage crops and potentially injure wildlife.
Hazard Vulnerability Analysis Summary
Due to the high frequency of events and substantial amount of property claims, the KIPDA region and each of its counties and their respective cities experience a moderate to high vulnerability to hail.
While this analysis applies to all KIPDA HMP counties and their respective cities, it should be recognized that counties with higher populations – Bullitt, Oldham, and Shelby – Bullitt, Oldham, and Shelby counties and their respective cities – are the most vulnerable during hail events. This is because hail’s primary impact in the region is property damage, and Bullitt, Oldham, and Shelby counties contain the greatest amount of building stock in the region due to higher population numbers.
- Bullitt County has over $3 million in property damage claims due to hail annually. Property damage data is only available at the county level.
- Bullitt County has experienced 22 hail events/21 years = 1.04 hail events annually.
- Bullitt County has the largest population in the KIPDA region and thus has a more substantial buildings stock. Hail’s primary impact in the region is property damage, which heightens Bullitt County’s vulnerability.
- Deaths or injuries due to hail are extremely rare.
Because of these factors, Bullitt County experiences moderate to high vulnerability to hail. Because each of its cities contain clusters of building stock, it can be assumed that Bullitt County’s cities experience moderate to high vulnerability to hail as well.
- Henry County has over $1 million in property damage claims due to hail annually. Property damage data is only available at the county level.
- Henry County has experienced 21 hail events/21 years = 1 hail event annually.
- While Henry County is significantly less developed and has substantially fewer properties than other counties, it still experiences a substantial number of property damage claims – totaling almost $13 million between 2010 and 2020.
- Deaths or injuries due to hail are extremely rare.
Because of these factors, Henry County experiences moderate to high vulnerability to hail. Because each of its cities contain clusters of building stock, it can be assumed that Henry County’s cities experience moderate to high vulnerability to hail as well.
- Oldham County has over $1.5 million in property damage claims due to hail annually. Property damage data is only available at the county level.
- Oldham County has experienced 28 hail events/21 years = 1.3 hail events annually.
- Oldham County has the second largest population in the KIPDA region and thus has a more substantial buildings stock. Hail’s primary impact in the region is property damage, which heightens Oldham County’s vulnerability.
- Deaths or injuries due to hail are extremely rare
Because of these factors, Oldham County experiences moderate to high vulnerability to hail. Because each of its cities contain clusters of building stock, it can be assumed that Oldham County’s cities experience moderate to high vulnerability to hail as well.
- Shelby County has just under $1 million in property damage claims due to hail annually. Property damage data is only available at the county level.
- In 2010, Shelby County experienced 190K in crop losses due to hail. This is the highest single year amount of any KIPDA county.
- Shelby County has experienced 26 hail events/21 years = 1.2 hail events annually.
- Shelby County has the third largest population in the KIPDA region and thus has a more substantial buildings stock. Hail’s primary impact in the region is property damage, which heightens Shelby County’s vulnerability.
- Deaths or injuries due to hail are extremely rare.
Because of these factors, Shelby County experiences moderate to vulnerability to hail. Because each of its cities contain clusters of building stock, it can be assumed that Shelby County’s cities experience moderate to high vulnerability to hail as well.
- Spencer County has over $1.8 million in property damage claims due to hail annually. Property damage data is only available at the county level.
- Spencer County has experienced 26 hail events/21 years = 1.2 hail events annually.
- While Spencer County is significantly less developed and has substantially fewer properties than other counties, it still experiences a substantial number of property damage claims – totaling almost $20 million between 2010 and 2020.
- Deaths or injuries due to hail are extremely rare.
Because of these factors, Spencer County experiences moderate to high vulnerability to hail. Because Taylorsville contain clusters of building stock, it can be assumed that Spencer County’s cities experience moderate to high vulnerability to hail as well.
- Trimble County has over $250K in property damage claims due to hail annually. Property damage data is only available at the county level.
- Trimble County has experienced 11 hail events/21 years = .5 hail events annually, which is substantially less than all other counties.
- Trimble County experienced less than $3 million in property damage claims between 2010 and 2020, which is substantially less than any other county.
- Trimble County is largely undeveloped and contains a limited building stock compared to other KIPDA counties.
- Deaths or injuries due to hail are extremely rare.
Because of fewer property claims and limited development, Trimble County has a moderate to high vulnerability to hail. Because Trimble County’s cities contain clusters of building stock, it can be assumed that Trimble County’s cities experience moderate to high vulnerability to hail as well.
References
[1] Yoksoulian, L. (2019, February 12). Are global warming, recent Midwest cold snap related? Retrieved July 24, 2020, from https://news.illinois.edu/view/6367/750060
[2] Correction for Liu et al., Impact of declining Arctic sea ice on winter snowfall. (2012). Proceedings of the National Academy of Sciences, 109(17), 6781-6783. doi:10.1073/pnas.1204582109
[3] Xie, Z., Black, R. X., & Deng, Y. (2017). The structure and large-scale organization of extreme cold waves over the conterminous United
States. Climate Dynamics, 49(11-12), 4075-4088. doi:10.1007/s00382-017-3564-6
[4] Hayhoe, K., VanDorn, J., Naik, V., & Wuebbles, D. (2019). Climate Change in the Midwest Projections of Future Temperature and Precipitation. Climate Change in the Midwest Projections of Future Temperature and Precipitation. Retrieved July 24, 2020, from https://www.ucsusa.org/sites/default/\iles/2019-09/midwest-climate-impacts.pdf
[5] Brimelow, J. C., Burrows, W. R., & Hanesiak, J. M. (2017). The changing hail threat over North America in response to anthropogenic climate change. Nature Climate Change, 7(7), 516-522. doi:10.1038/nclimate3321
[6] Biello, D. (2007, December 05). Thunder, Hail, Fire: What Does Climate Change Mean for the U.S.? Retrieved July 24, 2020, from https://
www.scienti\icamerican.com/article/thunder-hail-\ire-what-does-climatechange-mean-for-us/
[7] Tang, B. H., Gensini, V. A., & Homeyer, C. R. (2019). Trends in United States large hail environments and observations. Npj Climate and Atmospheric Science, 2(1). doi:10.1038/s41612-019-0103-7
[8] Vincelli, P., Meyer, L., Burris, R., Coolong, T., Bessin, R., Bewley, J., . . . Wagner, G. (2011). Climate Change: A Brief Summary for Kentucky Extension Agents [Scholarly project]. In Http://www2.ca.uky.edu/agcomm/pubs/id/id191/id191.pdf. Retrieved from UK College of Agriculture, Food and Environment Lockup
[9] USDA Risk Management Agency (2021). Cause of loss. [Data set]. Retrieved from https://www.rma.usda.gov/en/Information-Tools/Summary-of-Business/Cause-of-Loss
[10] Williams, Ashley (n.d). What are your chances of being killed by hail in the U.S. Retrieved from https://www.accuweather.com/en/weather-news/what-are-your-chances-of-being-killed-by-hail-in-the-us/333722